RICE Prioritization Framework
· 6 min read ·

Prioritisation is tough. It’s qualitative. It’s quantitative. And everything else in the middle. There is no magic formula that will work in every company or every situation. It requires both analytical and soft skills to get agreement on. But there are frameworks that can help make the job a little bit easier. They enable you to bring together all your analysis and findings in a cohesive manner that everyone can understand.
In this article we will look into one such framework- RICE Scoring.
The RICE prioritisation was authored by Sean McBride at Intercom. Over the years it has become one of the most popular frameworks to prioritise product development. It is extensively used by product manager all over the world to help make the right product prioritisation decisions.
What does RICE stand for?
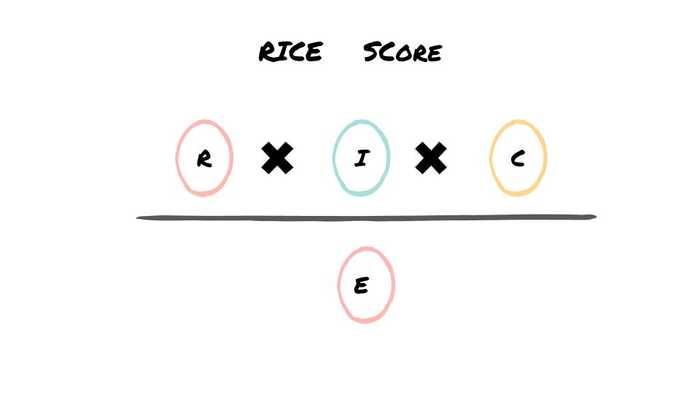
RICE stands for Reach, Impact, Confidence and Effort. You assign values to each of these variables to come up with a RICE Score. The feature with the highest score is at the top of the To Do list. Let’s look at each of them.
REACH
Reach means how many users will be able to access the feature. Whether they use it or not is not important to calculate REACH. That is the IMPACT. Sometimes it can get confusing! The unit used is a percentage scale 0%-100% with 100% meaning everyone is able to access it.
How do you calculate REACH?
Calculating reach depends on the type of feature, change or project you want to do. For example if it’s an update that’s part of the basic flow for all users then the reach is 100%. Let’s look at a few examples:
B2C Example
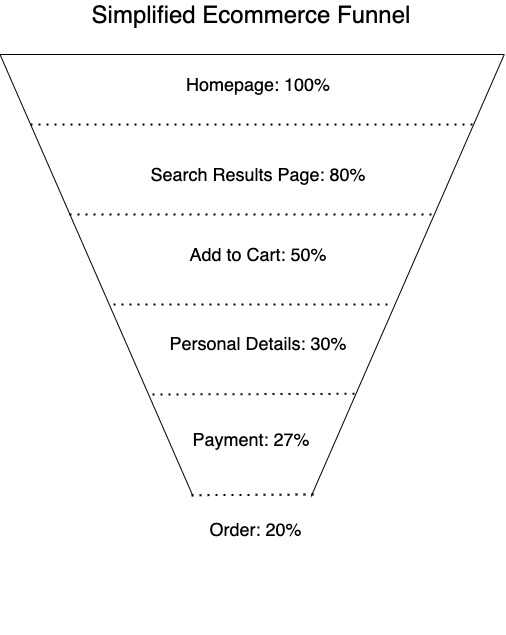
You are an e-commerce company looking to improve cart checkout conversion rate. In layman terms you want to increase the number of people who put a product in their cart and buy it. What would be the reach of this particular project.? Let’s assume a simplified checkout process. The current data tells you the following:
It’s not always as straightforward. A change in one step might have a corresponding impact on the next step. But we will assume that it is not significant.
B2B Example
Your product has three tiers- Basic, Professional and Enterprise. You are making a change in the Professional Tier. How will you calculate the reach? Find out:
(1) you can get from your sales or finance team. For (2) and (3) you will have to make your own projections which will be based on some assumptions
In this case REACH = X+Y+Z
IMPACT
Impact means what will be the benefit of the feature. How you quantify that benefit depends on a lot of factors? They are discussed in the next section. Assign one of the following values to benefit:
How do you calculate impact?
As mentioned above, impact depends on what the goal of the project is. Goal could be:
As part of creating the business plan or one pager for the project you would have assigned a value to this goal. That will help you access the impact.
Confidence
You will never have 100% of the data to predict the success of your project. Even with all the data there are always underlying assumption, external factors that might be beyond your control. The three metrics used in RICE; Reach, Impact and Effort are a mix of data that you have and assumptions you make along with it. The degree to which you feel your metrics are accurate is your confidence. The scale used for this is:
How do you calculate confidence?
Use a combination of both quantitative data and qualitative input from different sources to come up with this number. These values are also a reflection of your personality. Some people are hopelessly optimistic, other cautiously optimistic and the rest are pessimists. It is important that you don’t calculate the confidence level in isolation. Don’t let your personal bias drive the decision making.
Effort
This is the amount of time it would take to do this work. Out of the four metrics you’d think that effort would be the most straightforward. But if you’ve worked in software development long enough you know better 🙃 . Estimates are easy to come up with. Accurate estimates are almost impossible to come up with. The unit used to represent effort is “one person months”.
How do you calculate Effort
You can spend as much or as little time on estimating projects. The big question is how accurate do the results NEED to be at this stage of prioritisation. Or how accurate CAN the estimates be. At this stage you have not created detailed specs for the project that engineering can go over. It’s more likely a high level description of what the problem is and potential solution. So the estimates will be fairly rough. What has worked for me in the past is t-shirt sizing. It’s a rough estimate that you can come up by talking to the engineering manager. They would use their experience of tackling similar projects in the past to give high level estimates.
There are four t-shirt sizes:
You should try and break down XL projects into smaller more manageable releases.
RICE Score
This is the final number which you will use to stack rank your projects. The higher the RICE score the more important it is.
Learnings from Applying RICE Scoring
Customise measurement units
The first time I applied RICE I used the same measurement units that are in the original scoring method. I got RICE scores in decimals across a very large range of values. Visually it became very confusing to a lot of stakeholders. For example using whole numbers instead of decimals gave scores that were easier to read.
Educate the team
RICE is an easy and simple way for product prioritisation. But if you are seeing it for the first time it can get confusing. That’s what happened to me when I bought it up on the projector for the first time in a team meeting. People got confused with all the variables and scores across projects. So make sure you take out the time to educate the key stakeholders on RICE. Atleast the ones whose input you need to calculate the scores.
High & Low RICE Scores
The first few times my scoring looked skewed.
This is infact a reflection of how prioritisation exercises can sometimes end up. You have to continually push the team to think hard before making calls on what is important.
Scoring in Isolation vs Townhall
Since scoring requires input from a lot of different stakeholders it is important to get their input early on. But finding the balance of how many people need to provide input is important. In the beginning I did it alone and when that didn’t work I ended up having RICE scoring meetings with too many stakeholders. Both turned out to be futile.
Assumptions
This is true for a lot of things product managers do. Document everything. Especially assumption and the logic behind it while coming up with values for the RICE variables. It is valuable in case external factors that impact the assumption change.
At the end of the day any framework is only as good as the data in it. If it is well thought off and not a random figure taken out of thin air then the RICE score will paint an accurate picture. And provide structure to the product prioritisation process. We would love to hear about your experience of using RICE. Share with us.


